So I really hate Eclipse. Something fierce. And I have to admit it’s not really fair since I come from Visual Studios/C# which together can cost upwards of 2k to buy so it better be a great product. And Eclipse is free so you know, yah. But since IronPython may be dead, and it was annoying to set up anyway, I’ve been stuck with Eclipse… Until today. Turns out those Resharper guys (Resharper being the best thing ever since the last best thing ever.) made a Python IDE: PyCharm. At first I was all like “Whooa” then I was all like “Whoooooa” then I read there was no support for Pylons… then I was like “Wha?”.
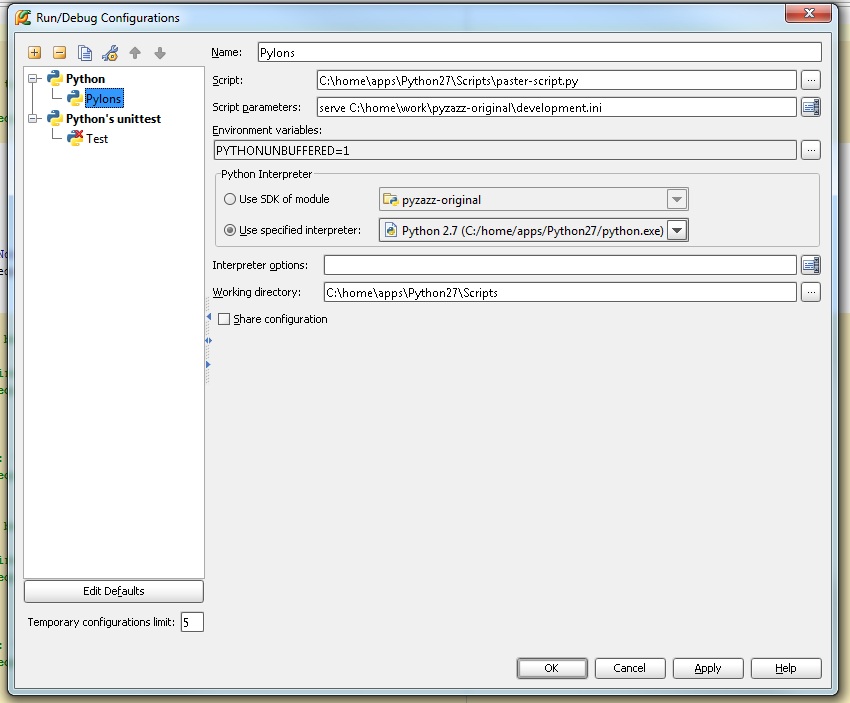
Although it looks like PyCharm doesn’t directly support debugging with Pylons, I took my limited knowledge from Eclipse and just hopefully bashed it into PyCharm…. and I made a screen shot:
It’s really simple.
Script is the Paster script that is normally used to start the serve.
Script Parameters is just the normal serve command used WITHOUT the –reload.
Make sure you grab the right python interpreter that has Pylons “installed” and away you go. Just have that one set as the current debug config and run it.
Once it’s up and running, just go to the page and set a breakpoint. Yay.

It really helped me after I spent 4 hours uselessly.